

In short
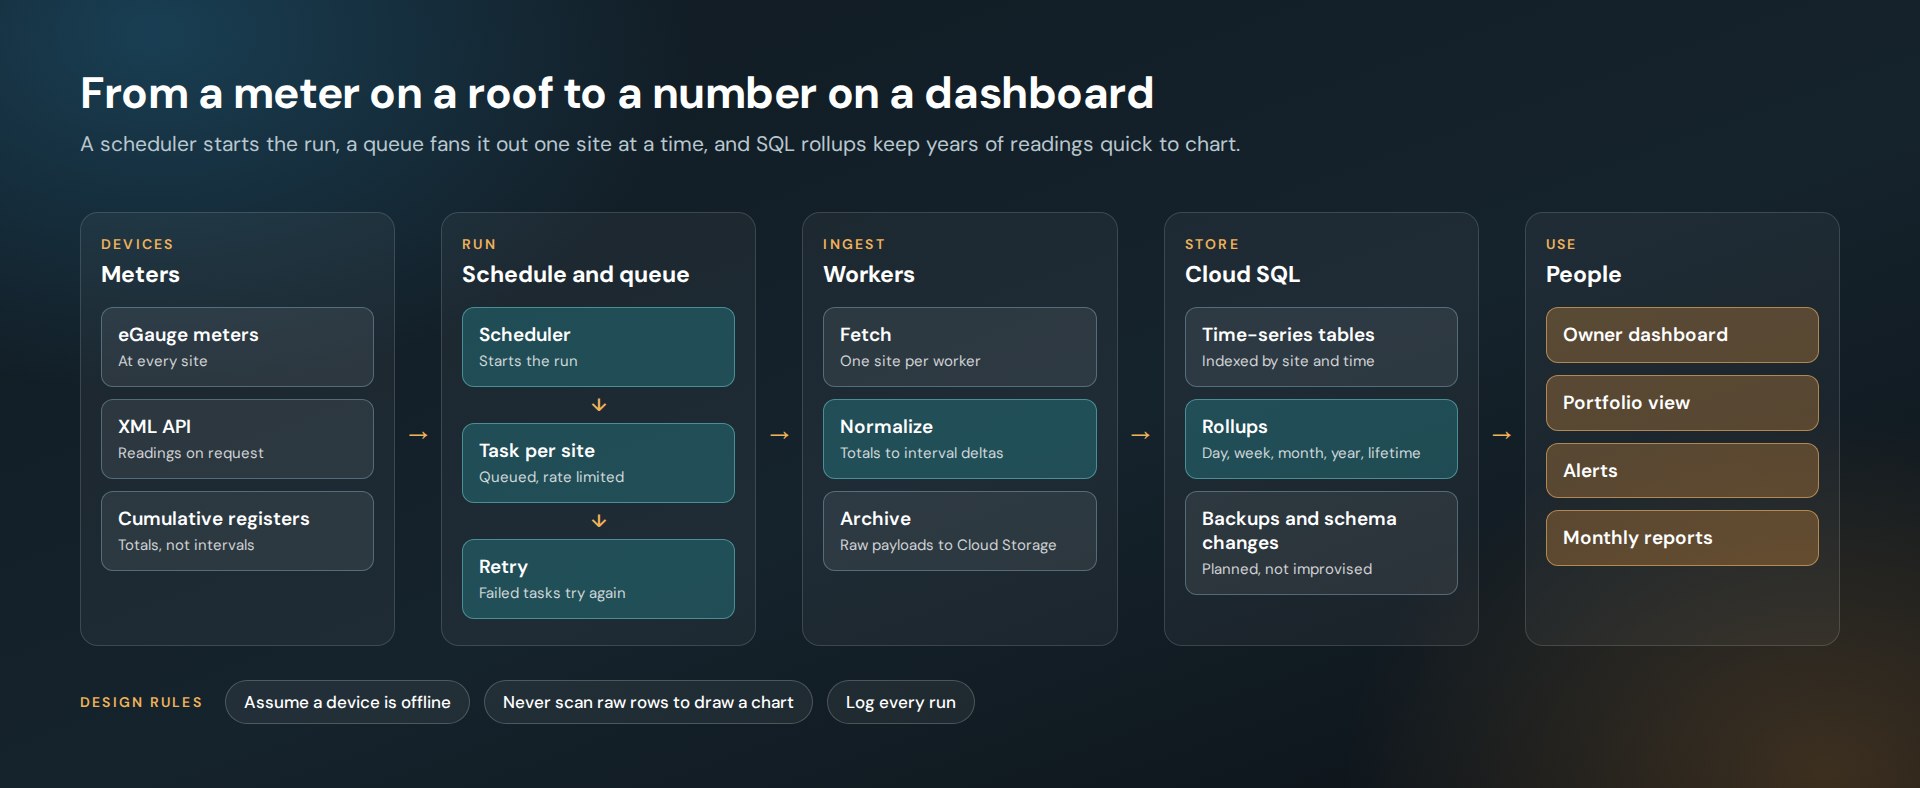
A telemetry pipeline collects readings from devices in the field and turns them into numbers people can act on. For Shorebreak Energy we built one on Google Cloud that pulls data from more than 100 eGauge meters. A scheduler starts each run, a task queue fans the work out one site at a time, workers normalize the readings into Cloud SQL, and pre-computed rollups keep years of history quick to chart. The design assumes some devices will be offline on any given run.
What does a telemetry pipeline do?
It moves measurements from devices to decisions. For a solar installer, the devices are meters on commercial rooftops. The decisions are simple to state: is every system producing, and is each one producing what was forecast?
Shorebreak Energy installs commercial solar and monitors those systems for their owners. We designed and built the platform behind that service. It reads from more than 100 eGauge devices and feeds owner dashboards, an operations view, alerts and monthly reports.
Why not poll every meter in one job?
Because devices in the field are unreliable in ordinary ways. A router restarts. A site loses power. A meter answers slowly.
If one job walks through every site in order, one slow meter delays all the sites behind it, and one failure can end the run. So the pipeline splits the work.
- A scheduler starts the run on a fixed clock.
- A master step queues one task per site.
- A worker handles one site: fetch the readings, normalize them, write them.
- A failed task is retried on its own, without touching the others.
Google’s own comparison of Cloud Scheduler and Cloud Tasks describes the split well. Scheduler is for triggering work at fixed intervals. Tasks is for queued work with rate limiting and automatic retries. A telemetry pipeline needs both.
How do raw readings become usable numbers?
The meters report cumulative readings. A cumulative reading is a running total, like an odometer. To chart production for a day, you need the difference between readings, not the readings themselves.
The ingestion services, written in PHP and Python, do three things with each response.
- Check it. Did the response arrive complete?
- Convert totals to intervals. Subtract each reading from the one before.
- Keep the original. Raw telemetry is archived in Cloud Storage, so a number can be traced back to its source.
How do you keep years of data fast to chart?
By never asking the dashboard to scan raw rows.
One-minute readings from many sites add up quickly. A chart of several years should not have to read all of them every time someone opens the page. The pipeline pre-computes summaries for day, week, month, year and lifetime, and the dashboards read those.
Underneath, the Cloud SQL work is unglamorous and it matters: an indexing strategy that matches how the data is queried, backup and restore workflows, and schema changes that are planned as the dataset grows. Cloud Storage lifecycle and retention rules do the same job for the raw archives.
What makes a pipeline like this reliable?
A few habits.
- Assume failure. Every device call can time out. Every task can be retried.
- Log every outcome. Success, retry or failure, per site, per run. When a number looks wrong, the log says whether the data arrived.
- Alert on silence. A system that stops reporting matters as much as one that reports a low number. A scheduled flatline check flags it.
- Keep operations simple. Deployments, storage administration and troubleshooting run through Google’s command-line tools, so routine work is repeatable.
What do people see at the end?
Four things, all reading from the same rollups.
- An owner dashboard with production, avoided cost and production against forecast
- A portfolio view for the operations team, with every site’s forecast and actual side by side
- Alerts when a system goes quiet
- Monthly client reports, in the app and as a PDF
The application layer is WordPress on Pantheon behind Fastly’s CDN, with custom dashboard components and JavaScript charts. The case study shows the screens.
Does this pattern apply outside solar?
Yes. Replace meters with any fleet of devices or any set of third-party APIs you have to poll: store locations, vehicles, sensors, partner feeds. The same four rules hold. Schedule the run, queue one unit of work per source, pre-compute what the screen needs and log everything.
Have devices or feeds that should be a dashboard?
Talk to us about your dataFrequently asked questions
What is a telemetry pipeline?
A telemetry pipeline collects measurements from remote devices, cleans and stores them, and makes them available to dashboards, alerts and reports. It usually includes scheduling, ingestion, storage and a reporting layer.
What is the difference between Cloud Scheduler and Cloud Tasks?
Cloud Scheduler triggers work at fixed intervals, like a cron job. Cloud Tasks manages a queue of individual tasks with rate limiting and automatic retries. Pipelines often use Scheduler to start a run and Tasks to distribute the work.
Why store raw telemetry as well as processed data?
Raw data lets you trace a reported number back to its source and reprocess history if the logic changes. Lifecycle and retention rules keep the storage cost under control.
How do you keep dashboards fast with years of readings?
Pre-compute summaries by day, week, month and year, and have the dashboard read those summaries. The page then never has to scan the raw readings to draw a chart.
