

Shorebreak Energy


Solar Monitoring Platform
Shorebreak Energy Developers builds commercial solar in California and keeps watching those systems for their owners after install. We designed and built the monitoring platform behind that service. An owner logs in to see what the system is producing right now, what it has saved and how it compares with forecast. Shorebreak’s operations team uses the same app to watch the whole portfolio.
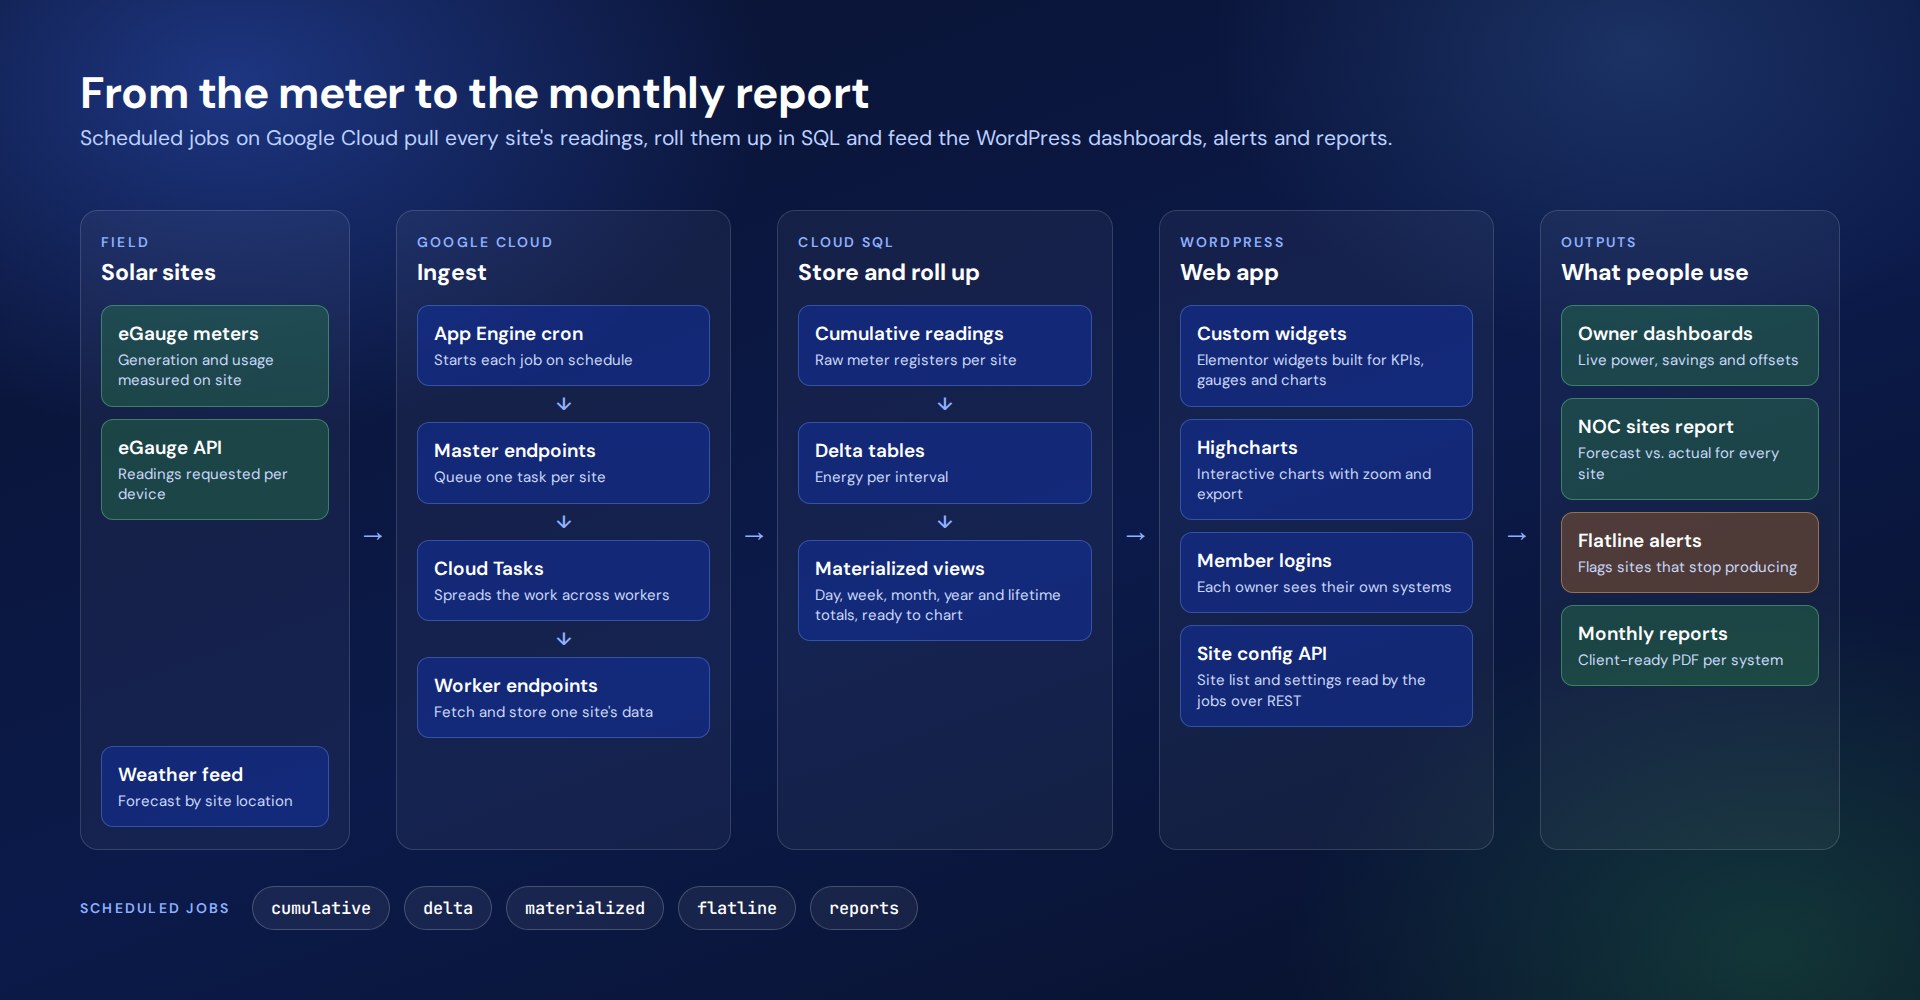
The platform has two halves. A data pipeline on Google Cloud collects readings from eGauge meters at every site and rolls them up in SQL. A WordPress app turns those numbers into dashboards, alerts and monthly reports, using custom Elementor widgets and Highcharts.
The route
How this project climbed.
- 01Origin Point
Shorebreak wanted to know how every system it had installed was performing each day, and to show owners the proof.
- 02Blueprint Base Camp
The data model: one-minute readings from eGauge meters, converted to intervals and rolled up by day, week, month, year and lifetime.
- 04Wireframe Switchbacks
Two levels of screen: a simple dashboard for an owner and a portfolio view for the operations team.
- 05Commit Ridge
A Google Cloud pipeline with one queued task per site, and custom Elementor widgets with Highcharts on the front.
- 06Staging Camp
Retries, logging and a flatline check, so one offline meter never stalls the rest.
- 08Go-Live Summit
Site dashboards, alerts and monthly client reports for every system.
Task
Shorebreak wanted to know how every system it had installed was performing each day, and its customers wanted proof that their solar investment was paying off. The challenge was to collect one-minute readings from meters at many sites on a schedule, keep years of history quick to chart, and present it at two levels: a simple dashboard for an owner and a portfolio view for the operations team. The platform also had to flag a system that went quiet and produce a monthly report for each owner.
Shorebreak Energy Developers builds commercial solar in California and keeps watching those systems for their owners after install. We designed and built the monitoring platform behind that service. An owner logs in to see what the system is producing right now, what it has saved and how it compares with forecast. Shorebreak’s operations team uses the same app to watch the whole portfolio.
The platform has two halves. A data pipeline on Google Cloud collects readings from eGauge meters at every site and rolls them up in SQL. A WordPress app turns those numbers into dashboards, alerts and monthly reports, using custom Elementor widgets and Highcharts.
The Site Dashboard
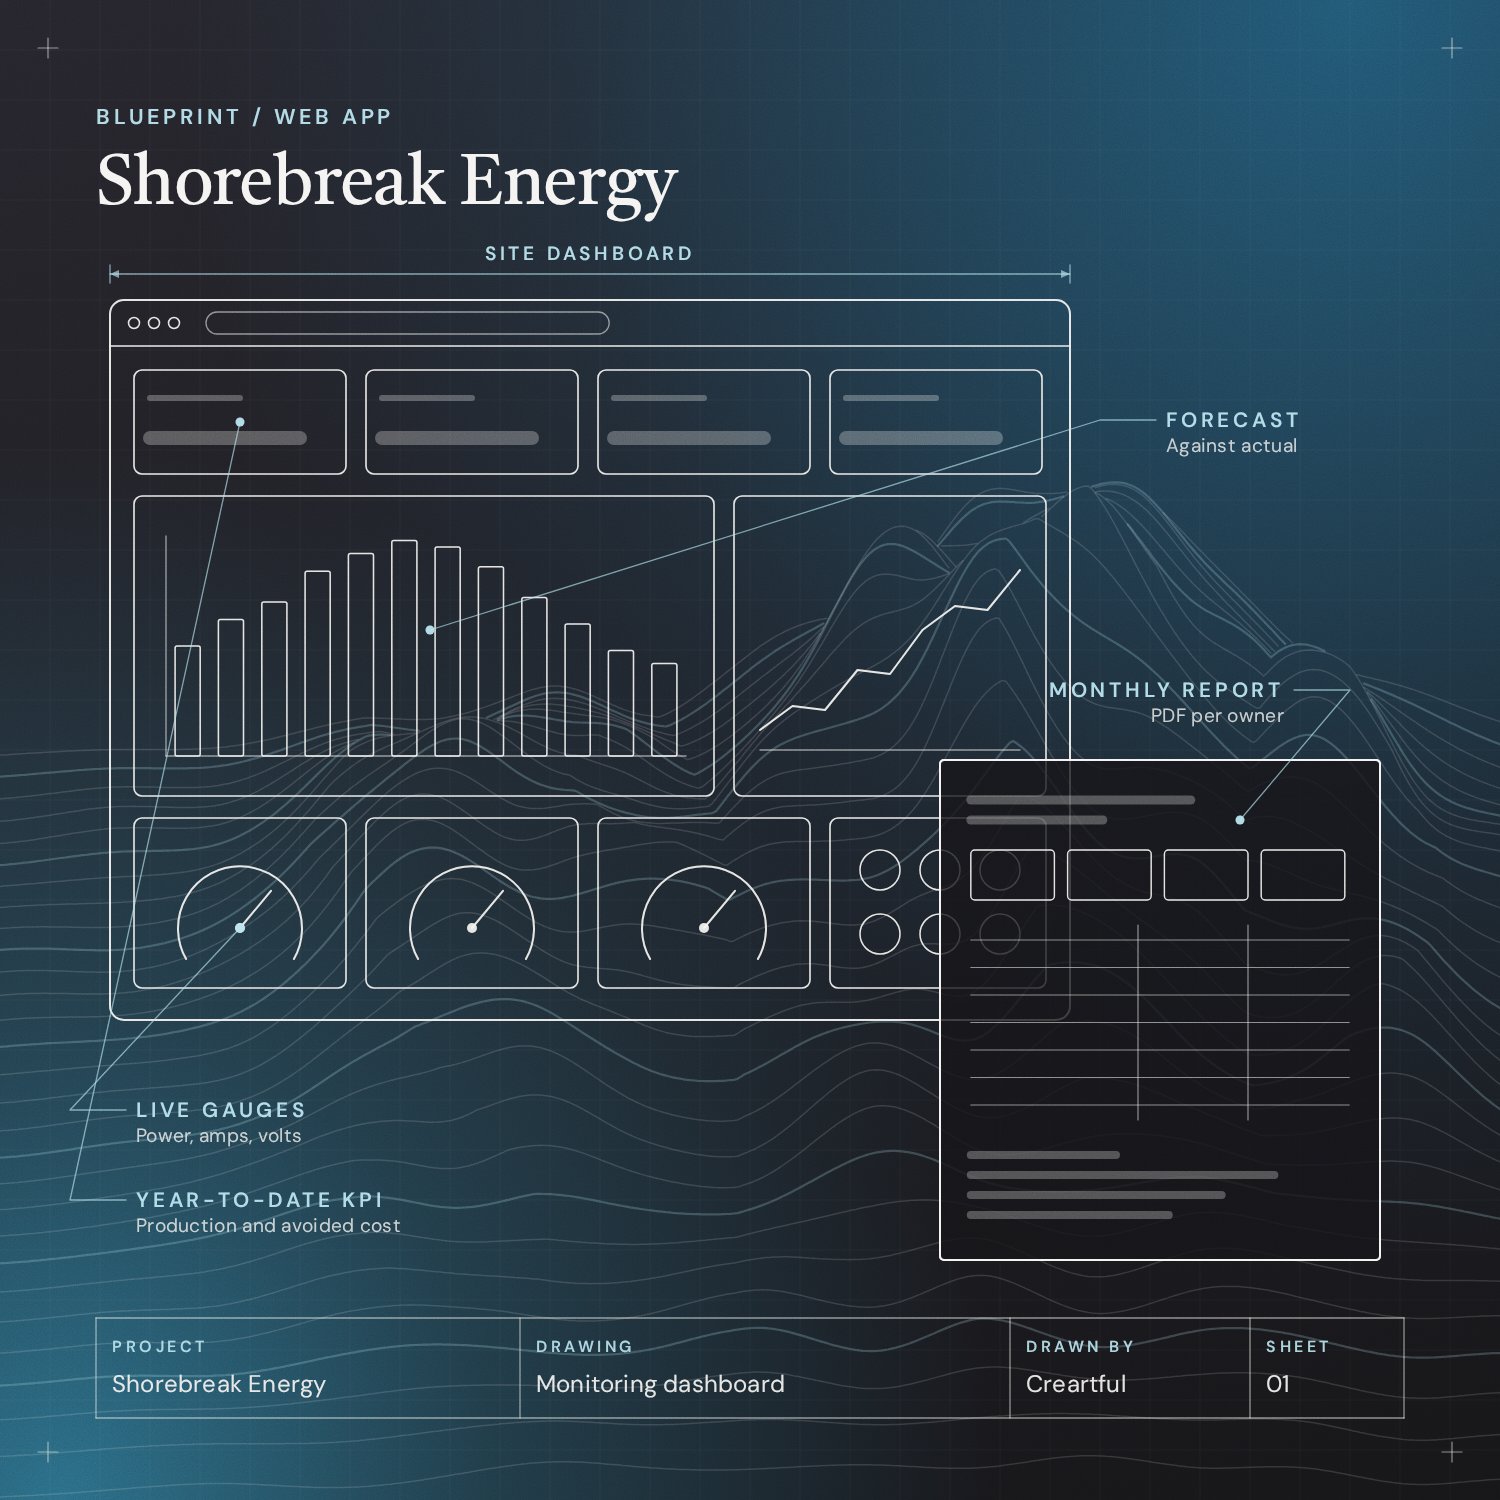
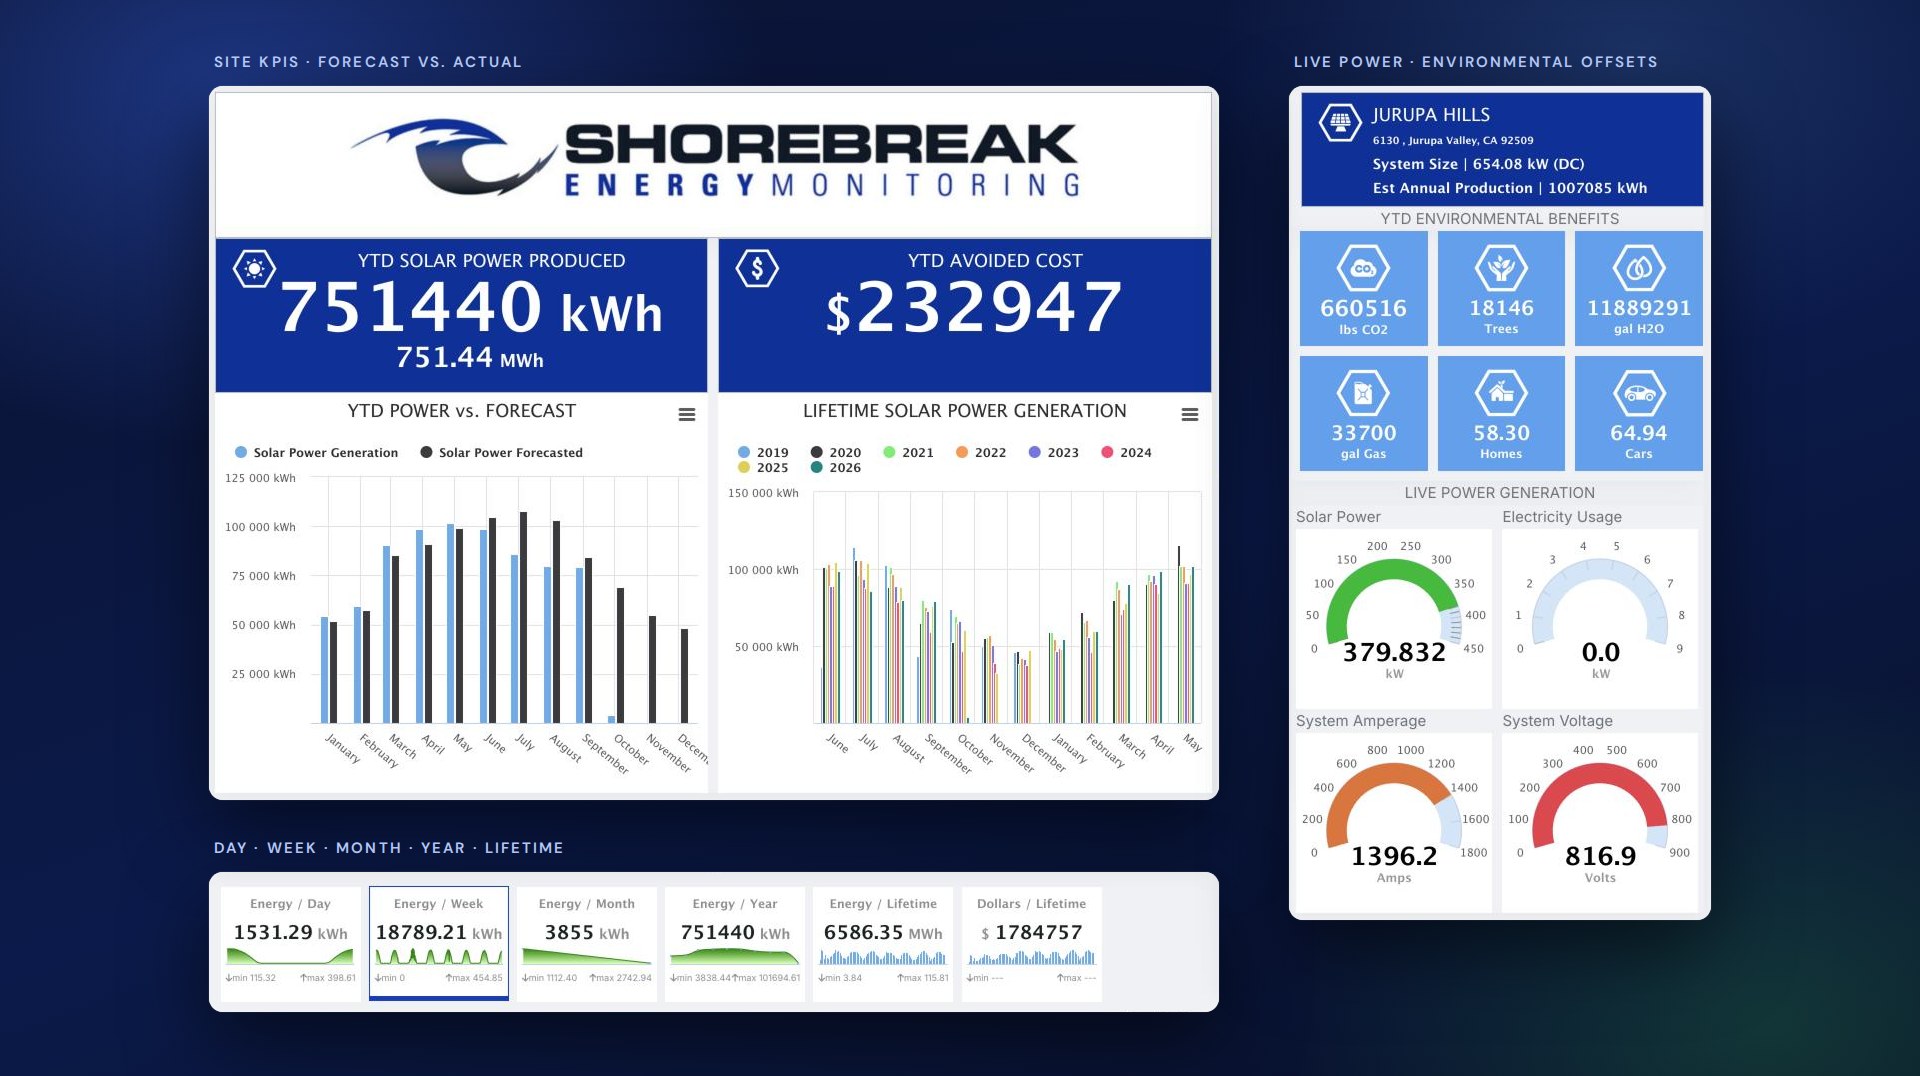
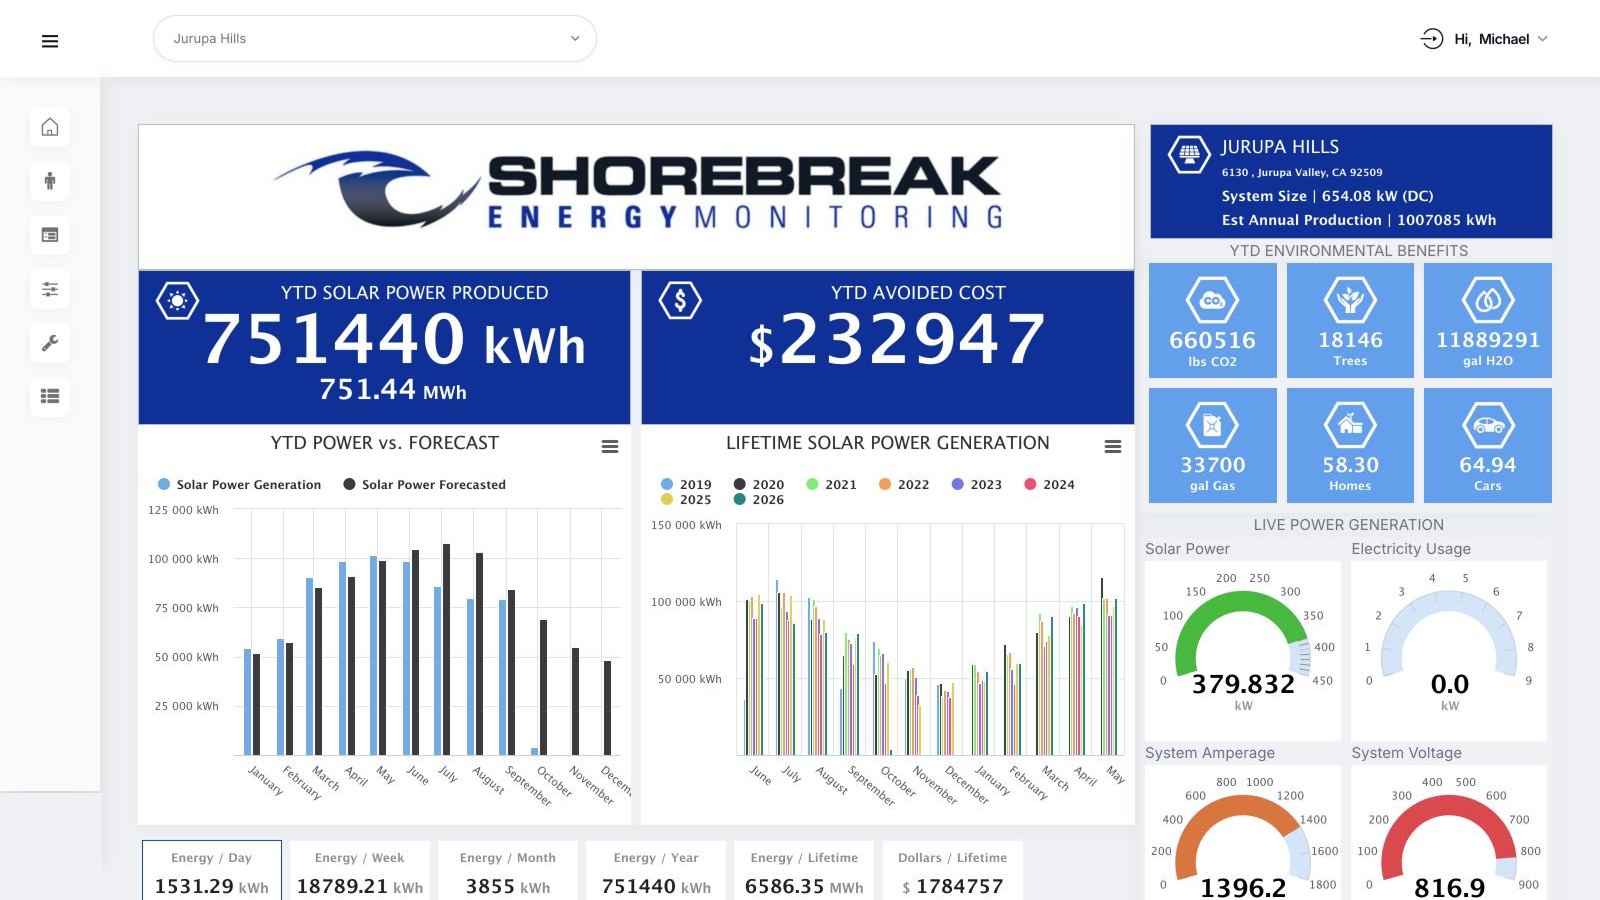
Each system has one page that answers the questions an owner asks. Year-to-date production and avoided cost sit at the top, with production against forecast and a lifetime comparison below. Live gauges show power, amperage and voltage, and a row of tiles converts the energy into CO2, trees, homes and cars.
Data Pipeline on Google Cloud
App Engine cron starts each job on a schedule. A master endpoint queues one Cloud Task per site, and a worker endpoint fetches that site’s readings from the eGauge API and writes them to Cloud SQL. Running each site as its own task means one slow or offline meter does not hold up the others.
Raw cumulative readings are converted to interval deltas and then summarized into materialized views for day, week, month, year and lifetime. The dashboards read those pre-computed totals and never have to scan years of raw readings. The site list and settings live in WordPress, and the jobs read them over the REST API.
Custom Widgets and Charts
Every block on the dashboard is its own Elementor widget: the KPI panels, the live gauges, the environmental offsets and the time-range tabs. Pages can be rearranged in the editor, and a new page can reuse any widget.
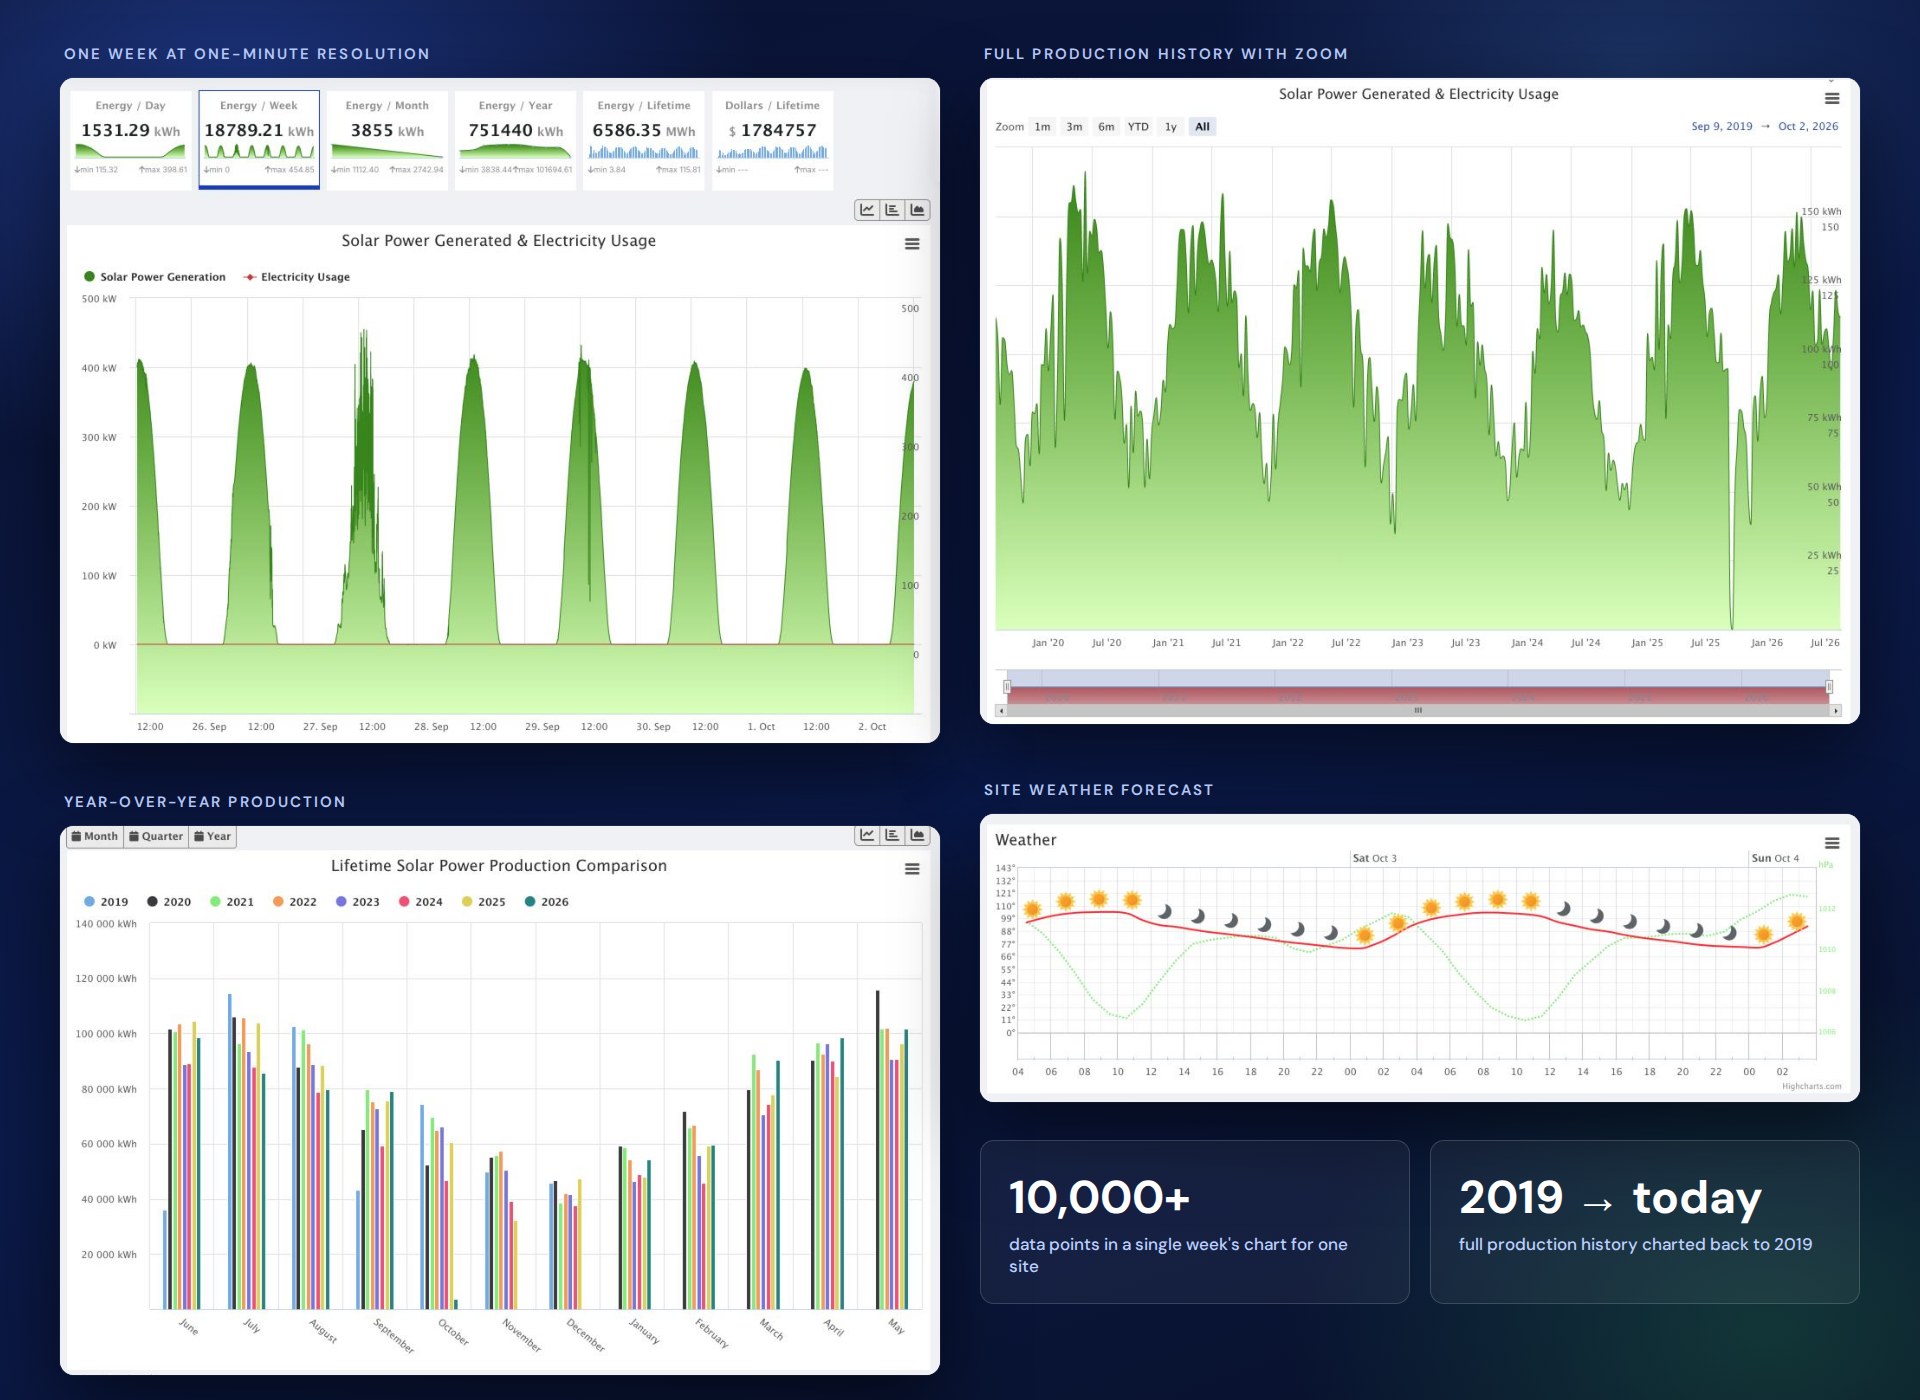
Highcharts and Highstock handle the charting. The app shows a week of one-minute generation and usage data, year-over-year production back to 2019, a zoomable full history and a weather forecast for the site’s location.
Portfolio View and Alerting
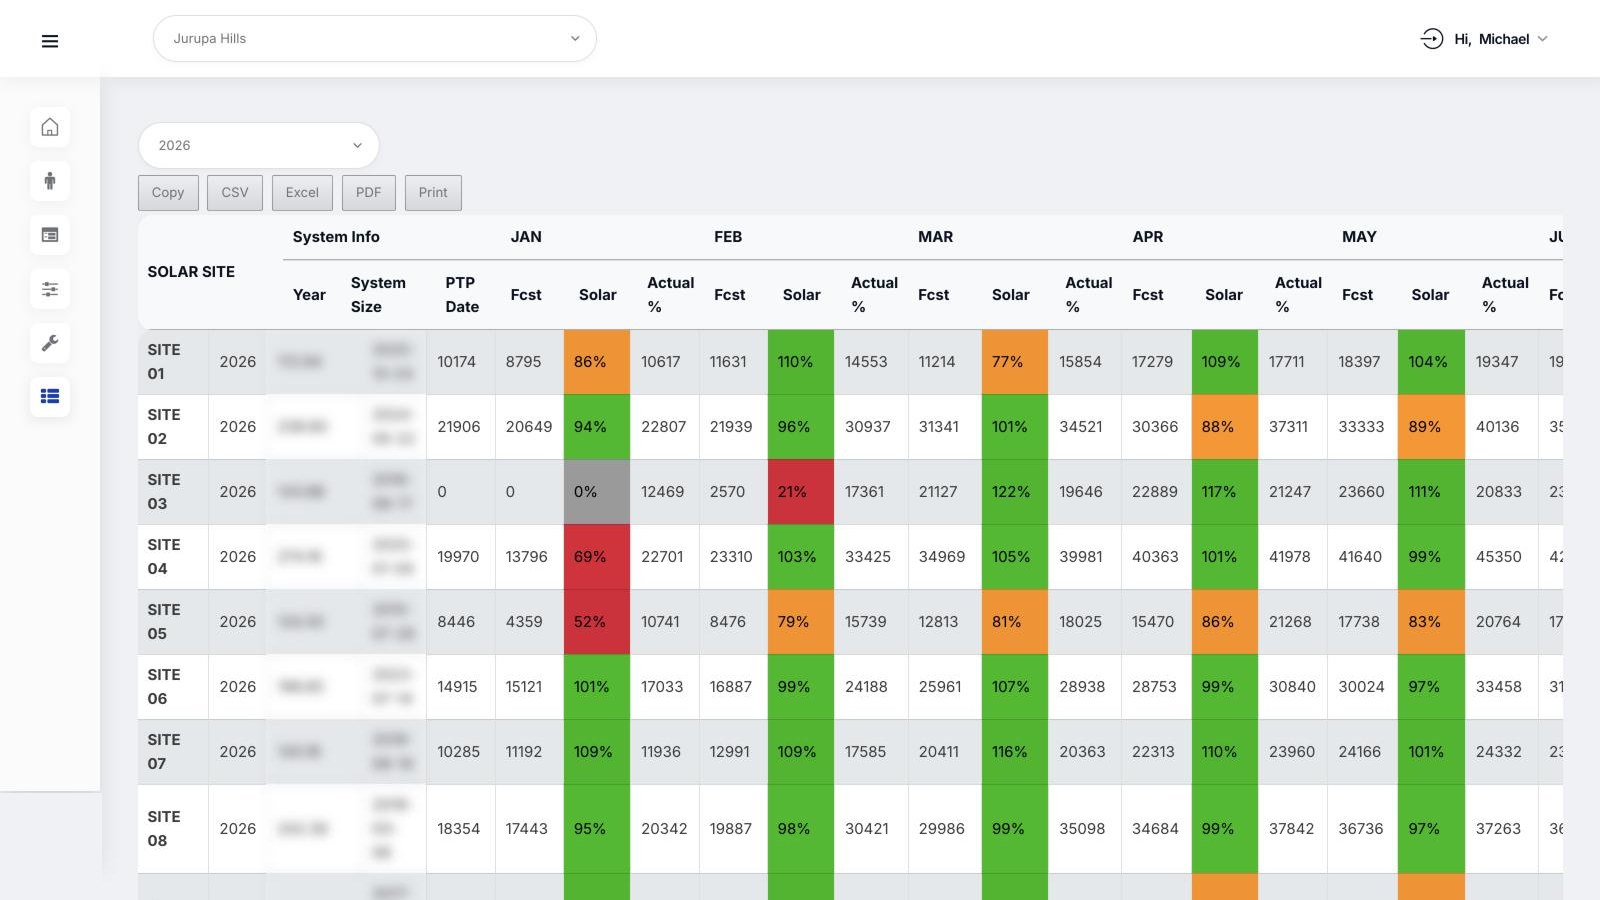
For the operations team, a sites report lists every system with its monthly forecast, actual production and the percentage between them. Cells are color-coded, so an under-performing site stands out, and the table exports to CSV, Excel and PDF. A scheduled flatline check flags systems that stop producing. Site names and system details are anonymized in this screenshot.
Monthly Client Reports
Every system gets a monthly report with year-to-date production against forecast, a month-by-month table and the environmental equivalents. Owners can open it in the app or download it as a PDF.
Platform at a glance
Meters in the field, numbers on a screen.
Pipeline
- PHP
- Python
- App Engine
- Cloud Scheduler
- Cloud Tasks
Data
- Cloud SQL
- Cloud Storage
- Rollups
Application
- WordPress
- Elementor
- Highcharts
- Pantheon
- Fastly
Reliability and Operations
The pipeline collects from more than 100 eGauge devices, and any one of them can be slow or offline on a given run. Monitoring, logging, retry handling and error management keep one unreachable meter from stalling the rest.

- aRetries and loggingEvery run records what arrived, what was retried and what failed.
- bCloud SQL careAn indexing strategy, backup and restore workflows and planned schema changes.
- cStorage lifecycleRaw telemetry archives in Cloud Storage with lifecycle and retention rules.
- dHostingWordPress on Pantheon behind the Fastly CDN.